Consumer Analytics
So you have come to Rapid to discover and consume APIs? Great! You can view and analyze all your API call history going back up to 1 year! You can break down traffic by App, API, Endpoint, and time directly in the platform, or export the raw logs.
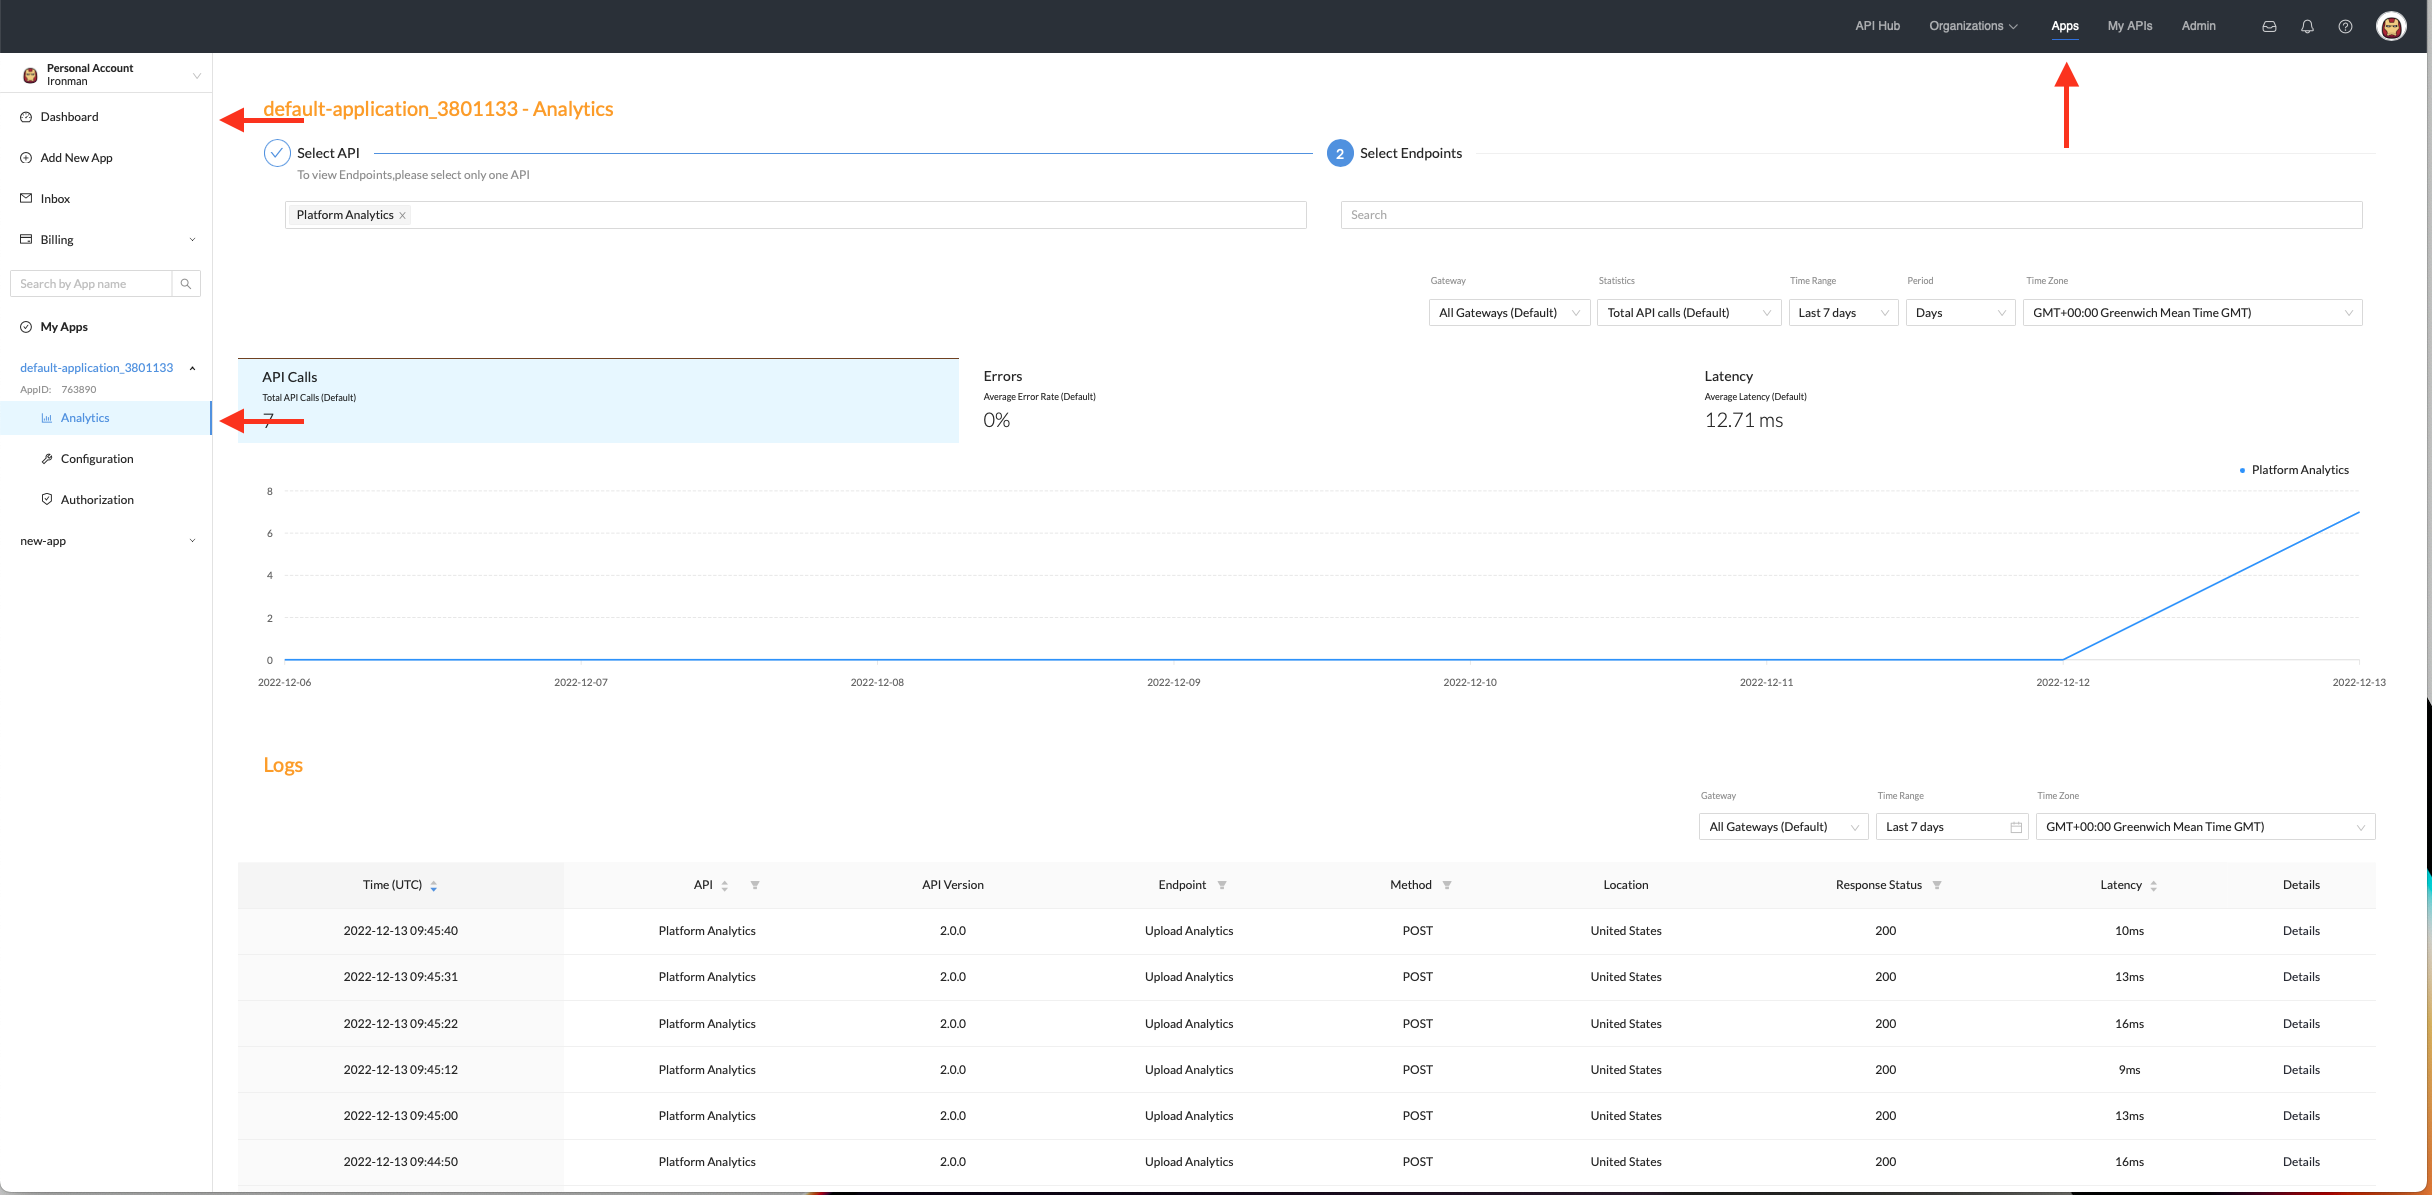
You can open the consumer analytics page through the “Apps” menu item. There are 2 different contexts from which to view analytics.
The first is the main dashboard for consumers. This page contains a near-real-time chart (5 min delay) that can be used to analyze your API traffic load, error rate, and latency. Based on the time periods you want to show, different resolutions can be used:
For each of those dimensions, you can replace the aggregation function to show the average, median, max, min, or total. The way to do that is by opening the dropdown near the dimension you would like to change the aggregation function for.
You can filter by API or the Gateway to which the request was sent (only relevant for enterprises with external gateways)
It is also possible to view analytics from the perspective of a single application. Here it is also possible to filter by endpoint, and the most recent logs are also available with the full request and response body/headers.

Updated 5 months ago
