Provider Analytics
Use the insights provided by consumer API calls to improve your API experience. Understand your API traffic by endpoint or consumer, monitor for errors, alert on latency spikes, and more.
To be usage from all consumers of your API, open any API in Studio and click Analytics in the sidebar.
Don't see any analytics?
If you click on the Analytics tab and see a Log Collection Methods heading, that means one of two things.
- Your API uses the Rapid Runtime, but no calls have been made to the API. You can use the API Playground (the API Hub) to make calls to you endpoint. After a few minutes, the Analytics tab should be populated.
- Your API has been configured to not use the Rapid Runtime. To populate the Analytics tab, you must use the Platform Analytics API or one of Rapid's Analytics Gateway Integrations instead.
Analytics in Studio.
For API providers, analytics is divided into four tabs:
Traffic analytics
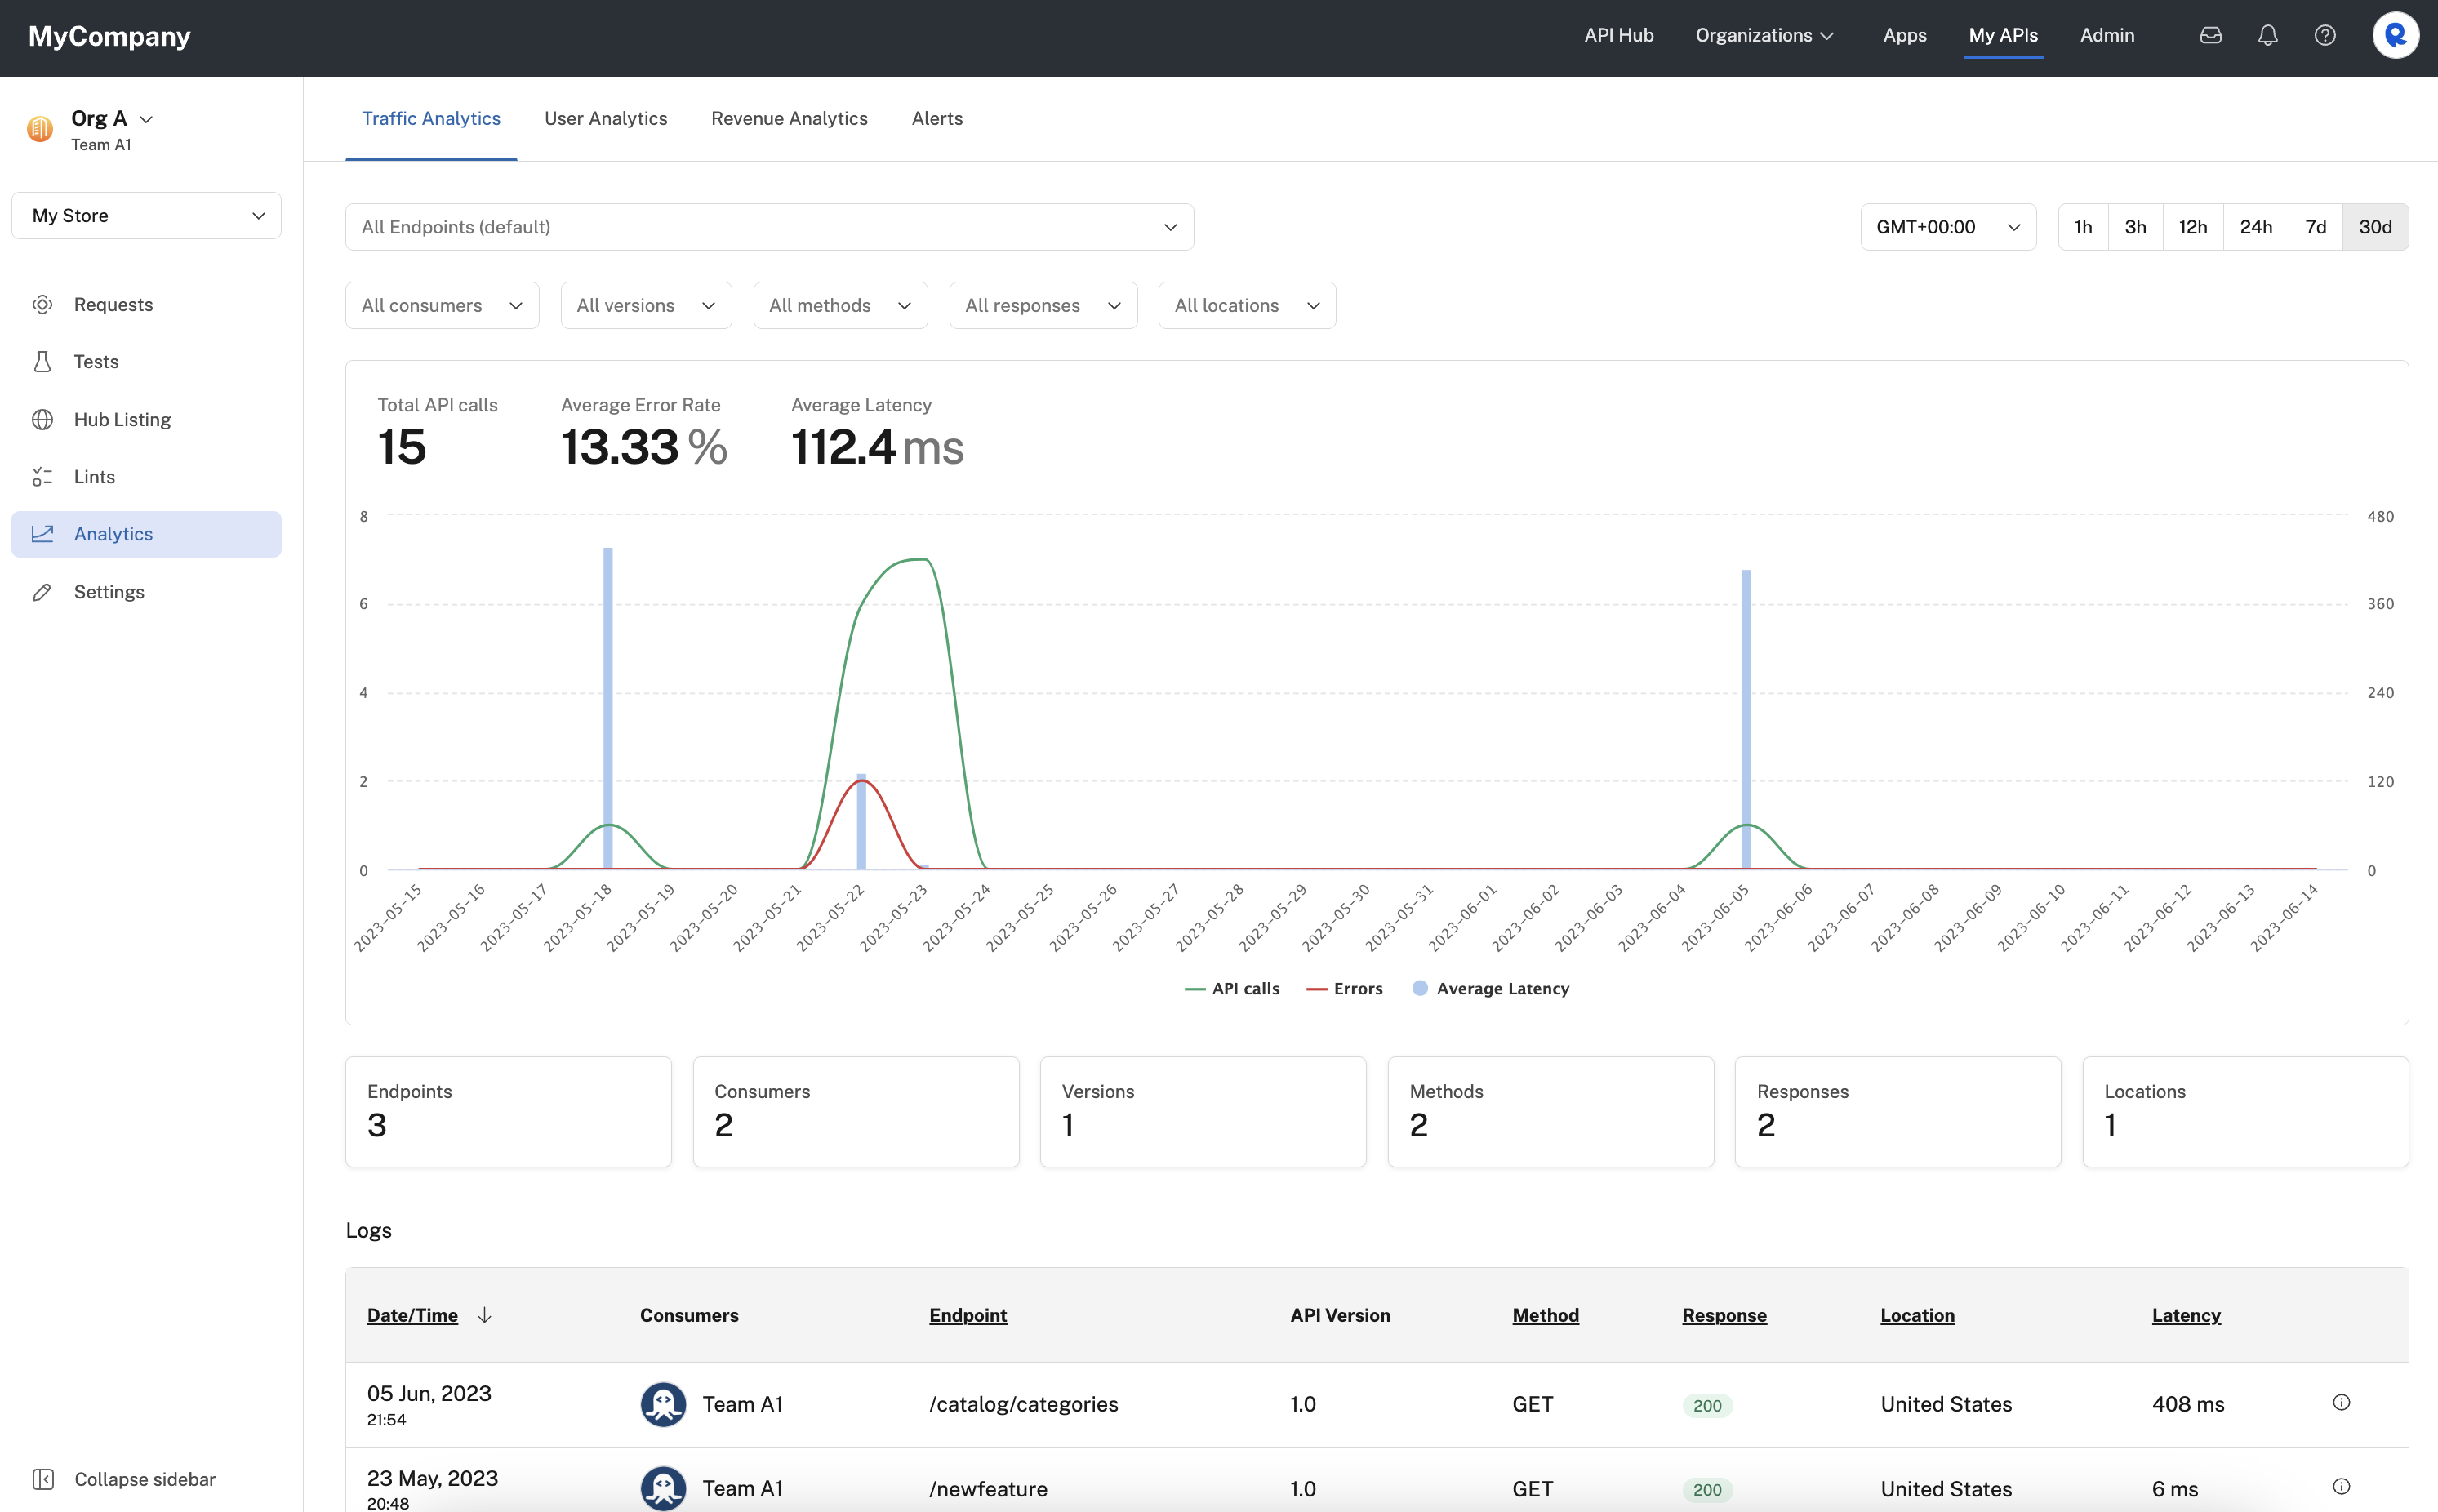
This page contains a near-real-time chart (maximum 30 second delay) that can be used to analyze your API traffic load, error rate, and latency. Based on the time periods you want to show, different resolutions can be used.
The chart on the Traffic Analytics tab simultaneously displays API calls, the number of API calls with errors, and the average latency of those calls. Total API call are displayed with a green line, with the scale shown on the left. Calls with errors are shown in red and also use the scale shown on the left. Latency is displayed using blue bars and uses the scale shown on the right.
You can hover over any point in the chart to view specific information for that day.
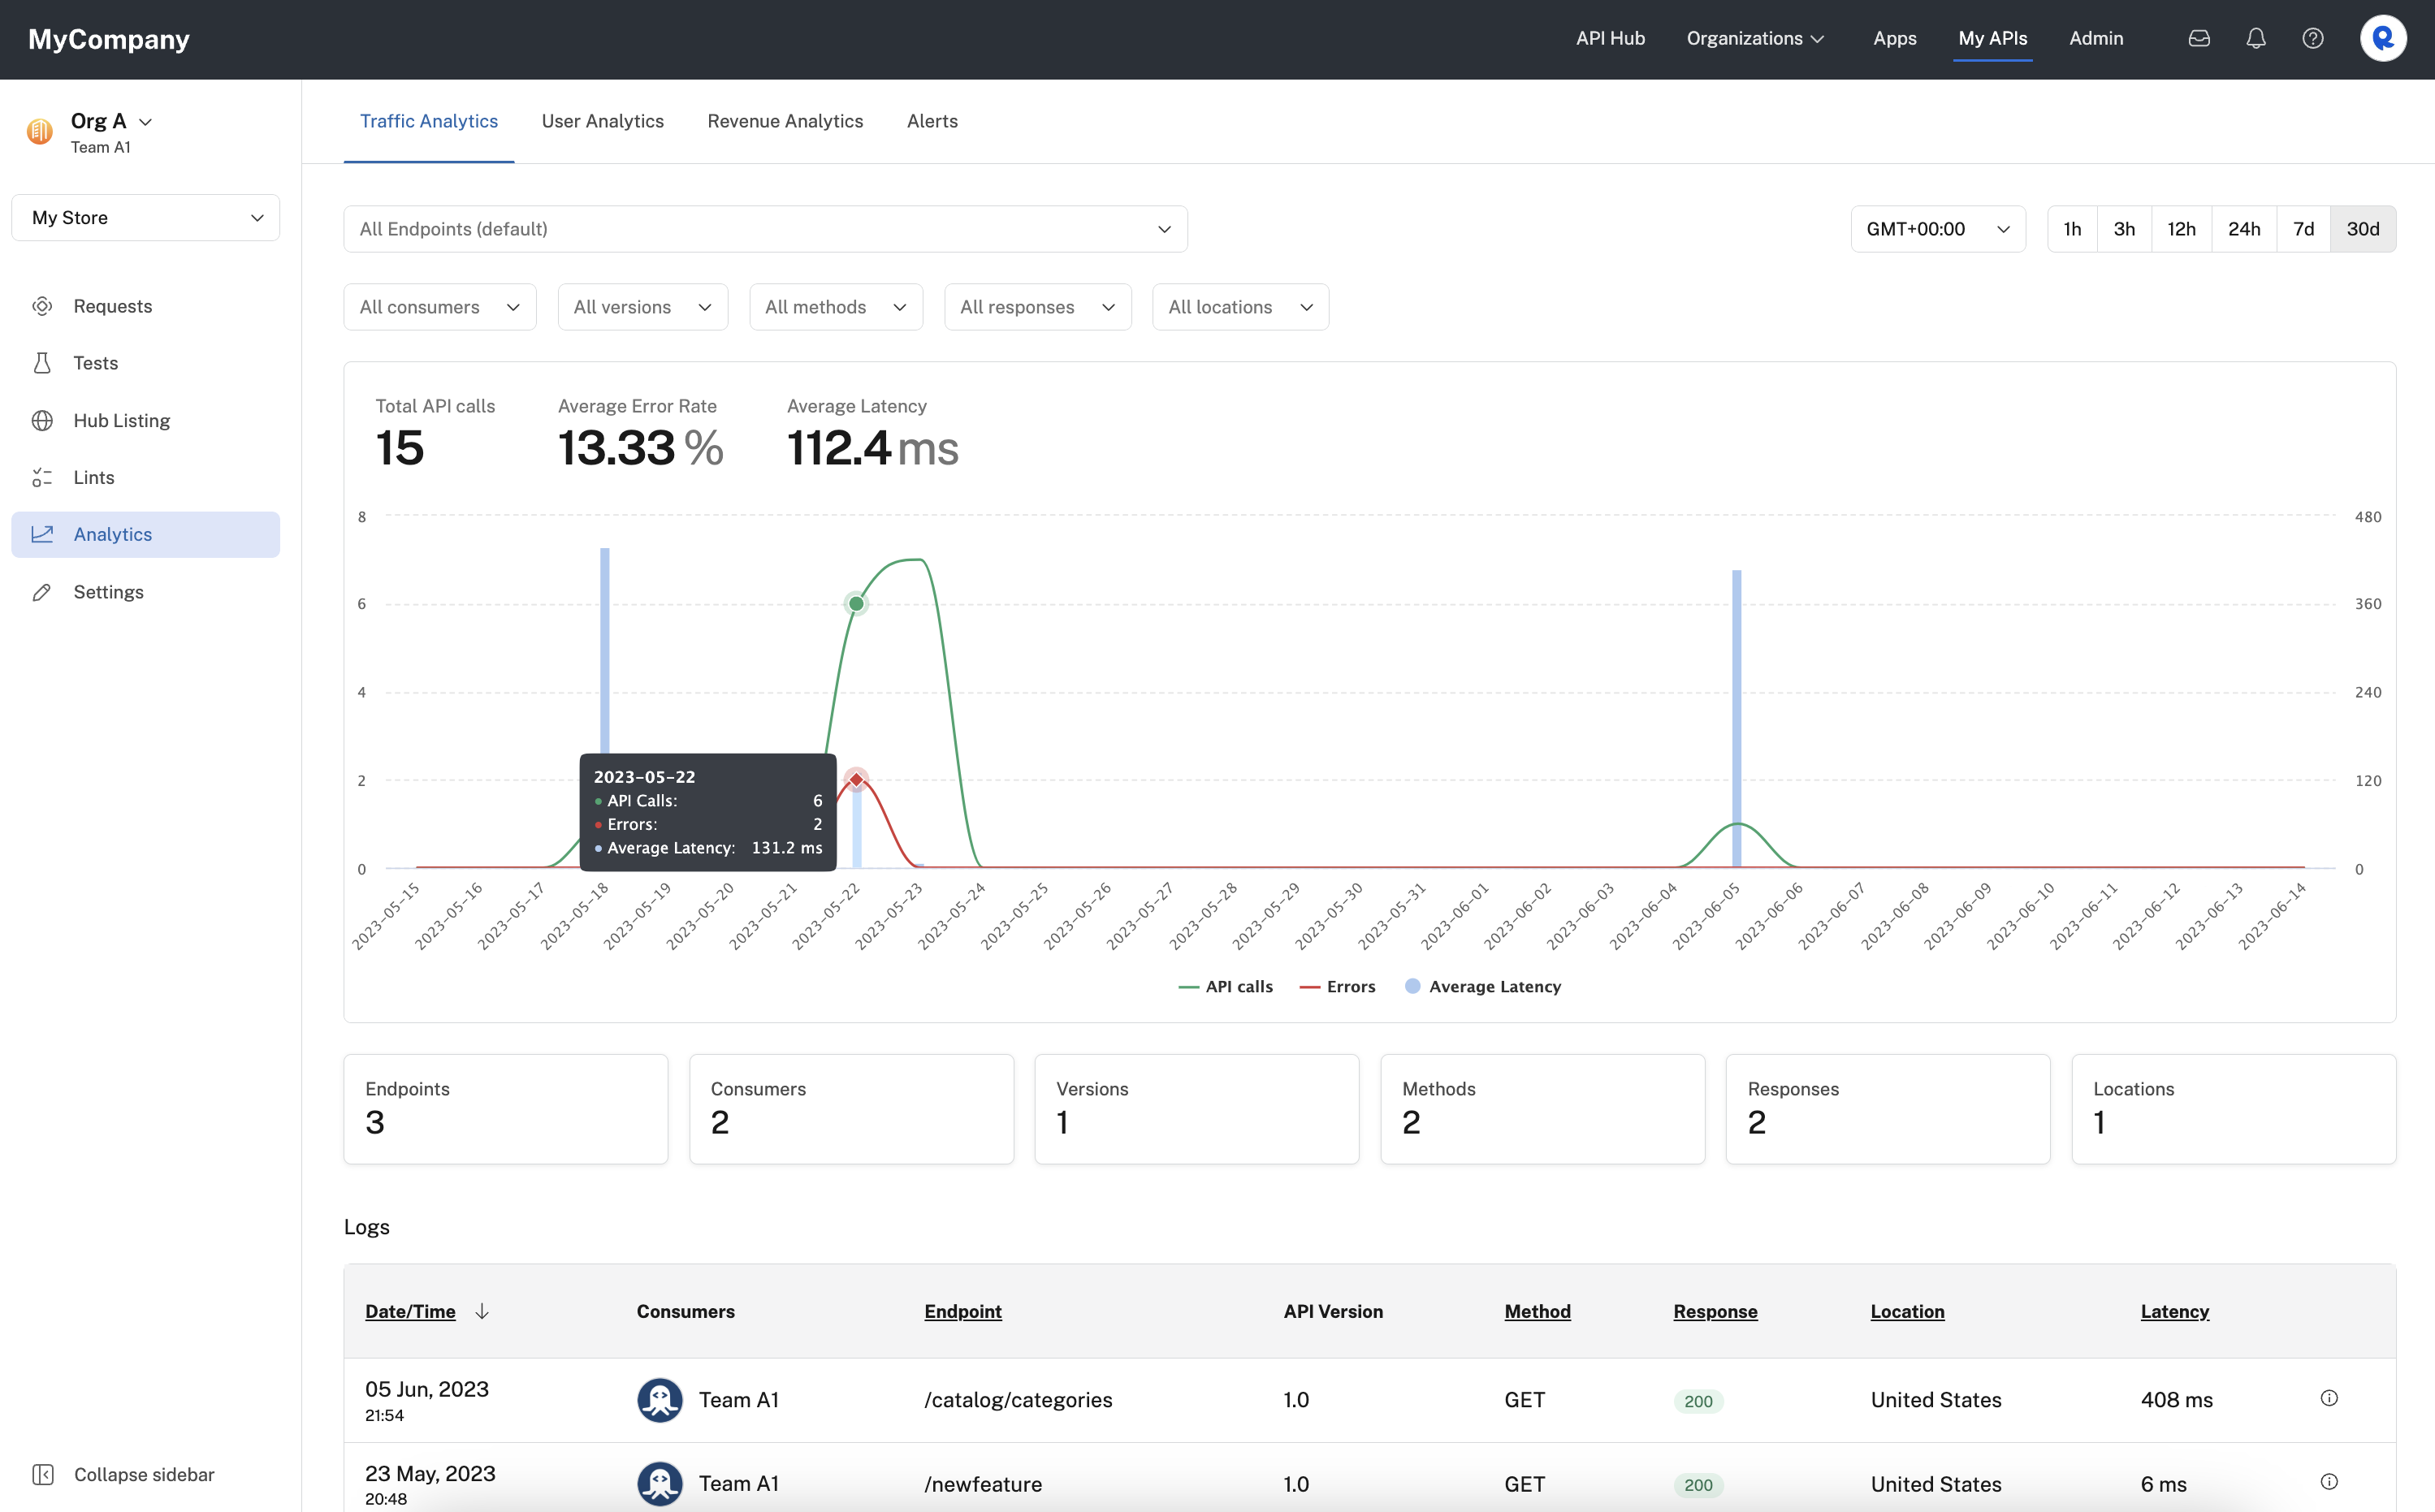
Hovering over a point in the traffic analytics charts to view details.
You can click the time period buttons in the top right to change the total time displayed on the chart. You can change the time zone used for the chart using the dropdown to the left of the time period buttons.
You can filter the information displayed on the chart using the dropdown boxes in the upper left. By default, all information is displayed. You can select one or more values from the dropdown to limit the information displayed. The following information can be filtered:
- Endpoints - By default, calls to all endpoints are displayed. Use this dropdown to only display calls from one or more of the API's endpoints.
- Consumers - Use this dropdown to limit the chart to display specific user and/or team consumers of your API.
- Versions - If your API has more than one major version, you can filter the chart to show only calls from specific versions.
- Methods - Use this dropdown to filter the chart include only specific HTTP methods, such as GET.
- Responses - Use this dropdown to filter the chart for specific HTTP response codes, such as 200 or 2XX responses.
- Locations - Use this dropdown to filter the chart by API consumer location.
The labels below the chart show the total number of Endpoints, Consumers, Versions, etc. currently shown on the chart. These values will change as you filter the chart.
Below the chart is a details listing of the logs. The listing is filtered using the filters above the chart. You can click the column names to sort by that column. You can click the information icon on the far right to view the details of the call. The example below shows the log details for a specific call to the API.
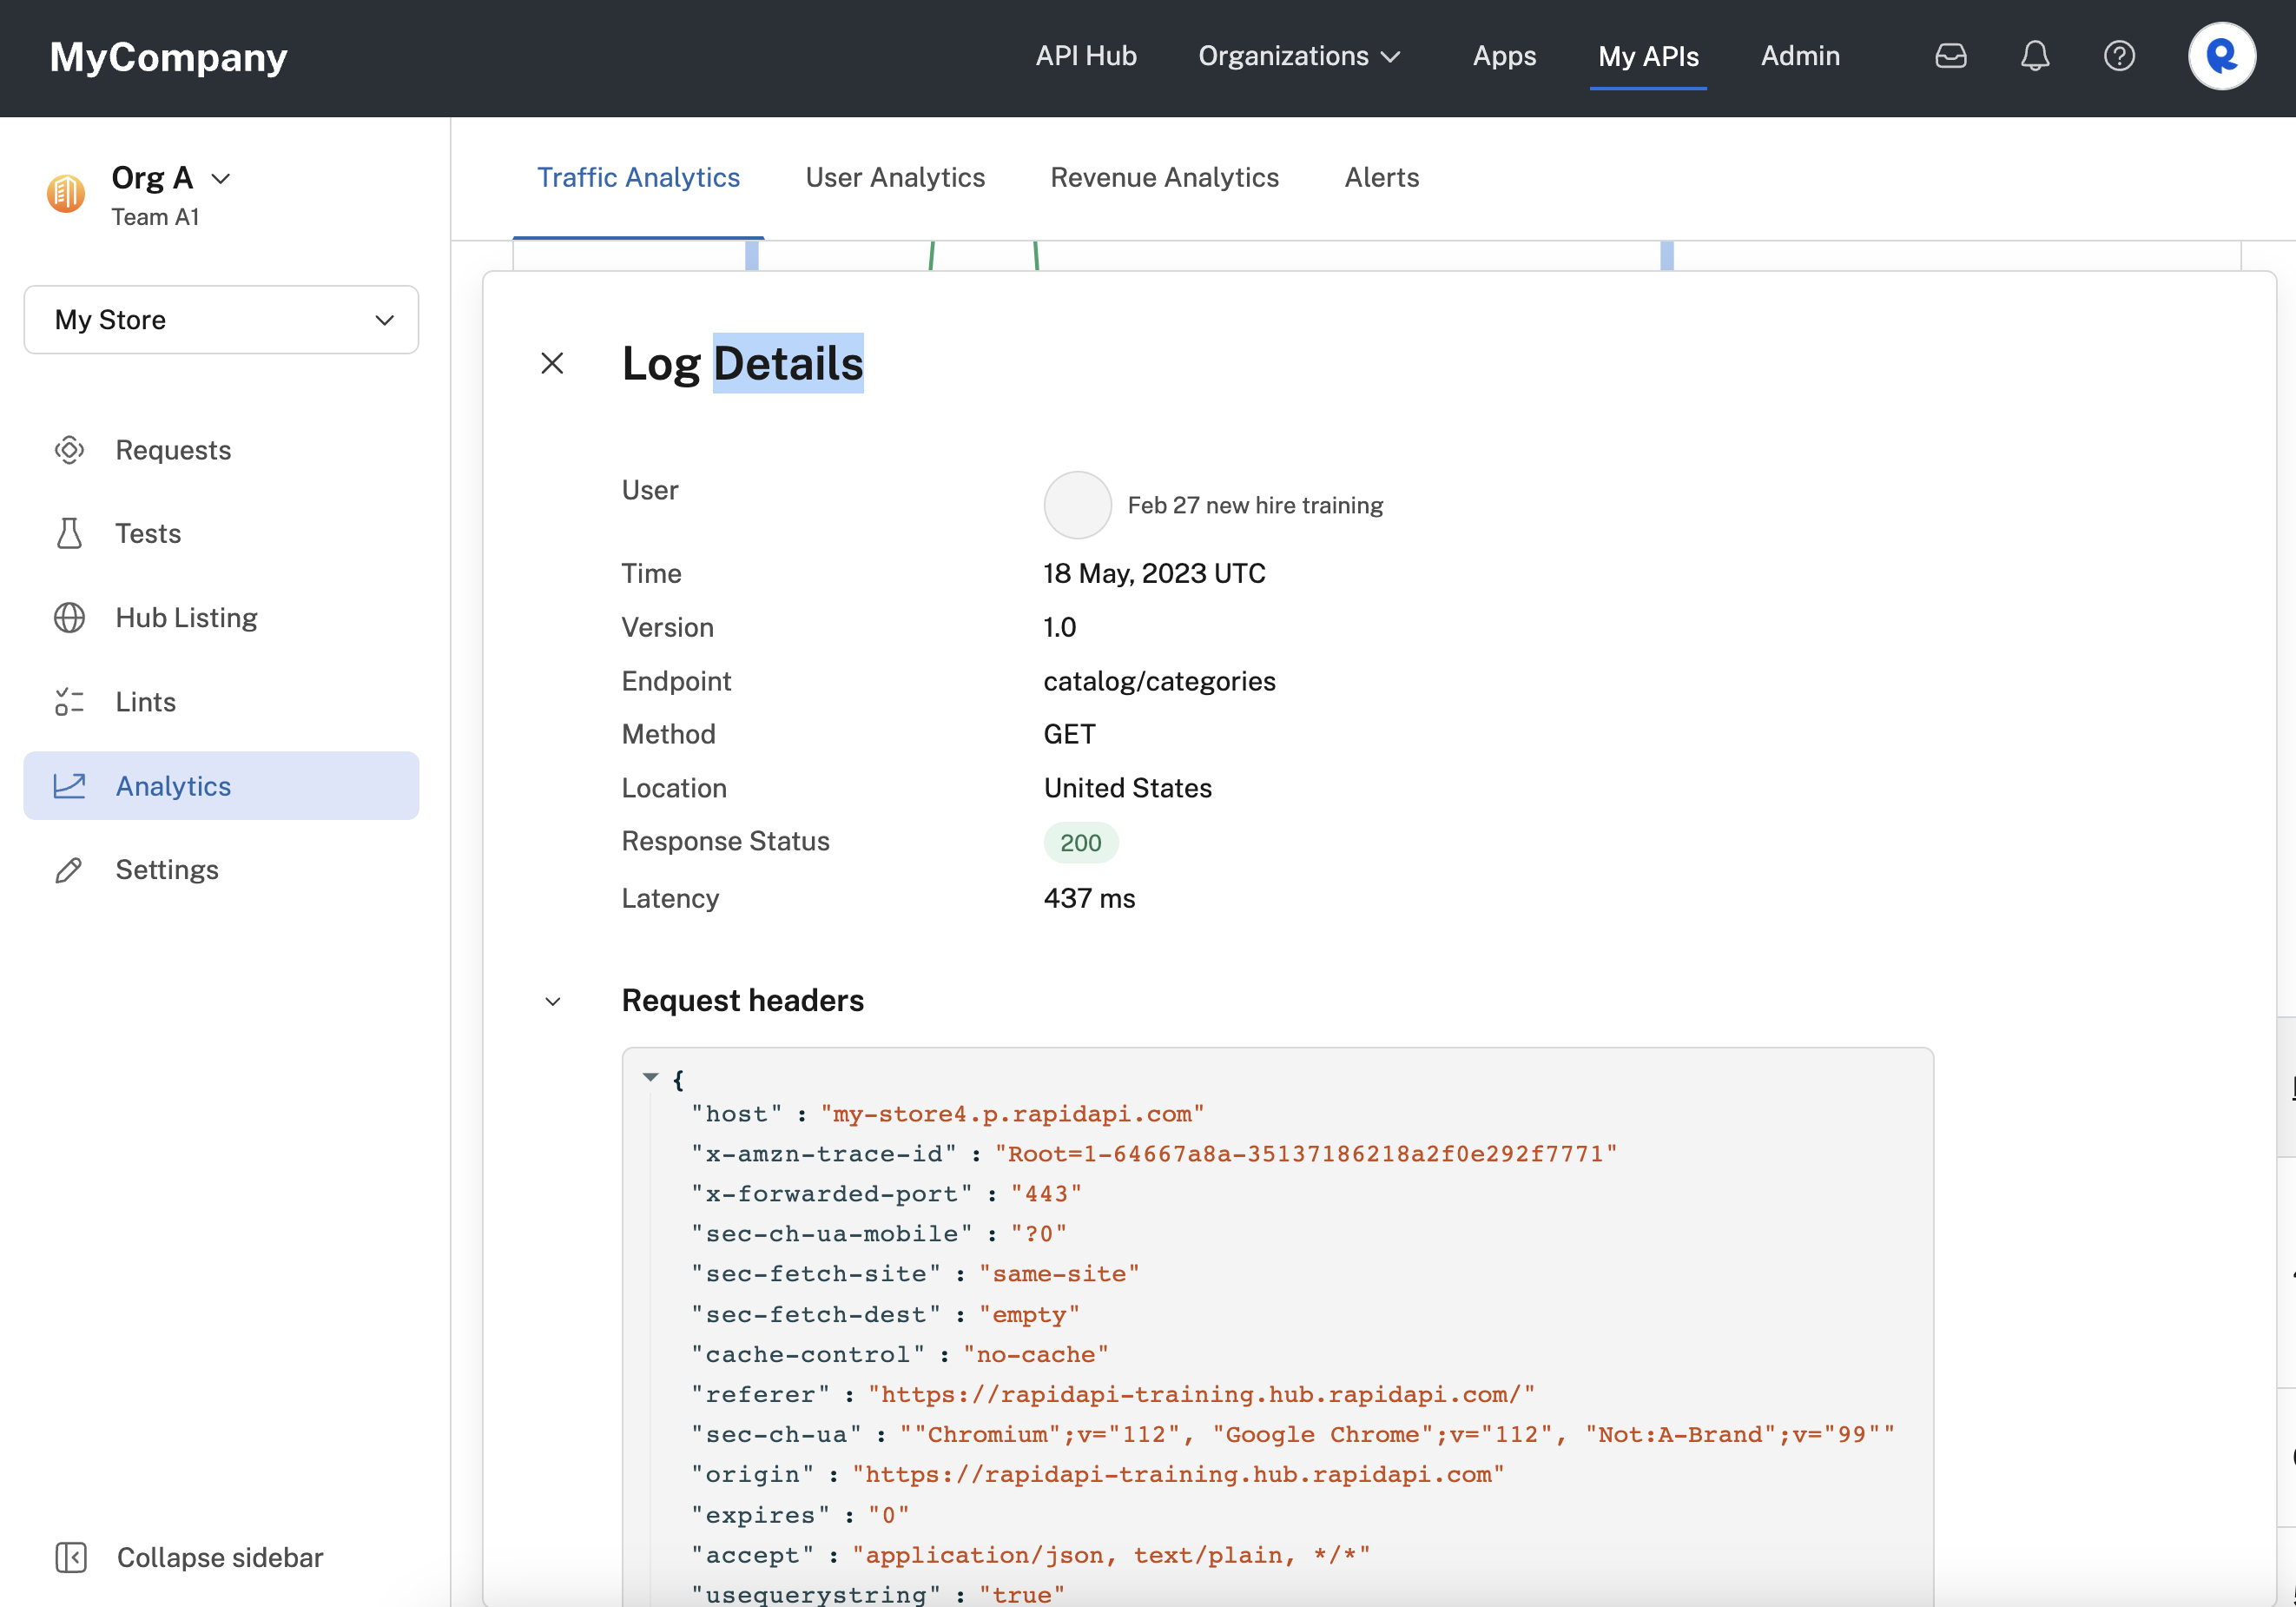
Details for a specific call to the API.
User analytics
As a developer, gain insights into your API consumers and monitor key metrics like active users (DAU, WAU and MAU) and total users for your API! Like traffic analytics, these widgets can be filtered by multiple time ranges and aggregation periods.
To view the user analytics for APIs that you or or team owns, in Studio (My APIs) select an API, then Analytics > User Analytics.

Viewing an API's user analytics in Studio.
Revenue analytics
For monetized APIs, providers can quickly understand income broken down by fixed price and overages for up to one year of history.
To view the revenue analytics for APIs that you or or team owns, in Studio (My APIs) select an API, then Analytics > Revenue Analytics.

Viewing an API's revenue in Studio.
Raw logs
As a developer, you can access up to 30 days of historical logs. They include the entire request content, including the headers, body, and response (can be disabled in enterprise subscription). In addition to that logs can be exported and analyzed using external tools like excel. Log records currently have the following columns:
- DateTime: The date and time the API call was made.
- User: The account which owns the application that made the API call.
- API Version: The version of the API that was called.
- Endpoint: The API endpoint that was called.
- Method: The API method used (POST, GET, PUT).
- Response Status: The response code for the API call.
- Latency: The amount of time in milliseconds from when the call was made until a response arrived.
- Content (blank): headers, body, and response content can be accessed by hovering over the row and selecting “Details”.

NOTE: The content section is currently not available for logs being imported via the Platform Analytics API.
Alerts
Rapid offers a no-code solution for setting thresholds on all key API metrics and creating custom alerts for when those thresholds are crossed within a specified time period.

Updated about 1 month ago