Release Notes (Nov 2023)
Enterprise Hub Release Notes
As always, our team is committed to providing you with the best possible experience with our product, and we appreciate your continued support and feedback. If you have any issues or bugs, you can report them to us at our support page here.
2023.11:
New:
- The Admin Panel's Dashboard tab has been updated to include more data and navigability. This helps you to understand, improve, and troubleshoot the APIs and users of your Hub. Updates include the following:
- The Users widget of the Governance section now has a link to the Users tab of the Admin Panel. For more information, see Governance.
- A Subscribers widget has been added to the Governance section, indicating the total number of team and user subscriptions to all APIs in the hub. Also, a convenient link to the Subscriptions tab has been added to the widget. For more information, see Governance.
- An API Providers widget has been added to the Governance section, indicating the total number of teams and users that have added at least one API to the Hub. Also, a convenient link to the Subscriptions tab has been added to the widget, which shows details that includes a "Provider" column for API subscriptions. For more information, see Governance.
- An Admins widget has been added to the Governance section, indicating the number of Environment Admin in your Hub. For more information, see Governance.
- A Billing section has been added. This is used if you monetize APIs in you Hub using Stripe. New metrics include gross volume (in dollars), net volume (in dollars) and successful payments (the total number of successful payments. For more information, see Billing.
- In the APIs section, the Total API Traffic widget now has a convenient link to the APIs tab of the Admin Panel. For more information, see APIs.
- In the APIs section, the Total Errors widget now has a convenient link to the Traffic analytics tab. This allows you to to see a more detailed breakdown of when the errors happened. For details related to a specific API, use the Analytics and usage tab for the API. For more information, see APIs.
- In the APIs section, the APIs displayed in the Highest Traffic APIs widget are now clickable. Clicking on the API name brings you to the Analytics and usage tab for the API. This allows you to explore usage details for the API. For more information, see APIs.
- The APIs section has a Most Popular APIs widget, which displays the five APIs with the highest number of teams or users that made at least one call to the API during the selected period. Clicking on the API name brings you to the Analytics and usage tab for the API. This allows you to explore usage details for the API. For more information, see APIs.
- In the APIs section, the APIs displayed in the Highest Error APIs widget are now clickable. Clicking on the API name brings you to the Analytics and usage tab for the API. This allows you to explore usage details for the API. For more information, see APIs.
- In the APIs section, the users and teams displayed in the Most Active Consumers widget are now clickable. Clicking on the API name brings you to the Analytics and usage tab for the API. This allows you to explore usage details for the API. Clicking on a user name navigates you to the user in the Users tab of the Admin Panel. Clicking on a team name navigates you to the Organizations tab of the Admin Panel. For more information, see APIs.
- The Analytics and usage tab of the Admin Panel's APIs tab has been updated to include the following capabilities. For more information, see Managing APIs.
- You can filter the information displayed in the API usage graph by selecting one or more of the dropdown boxes above the graph. You can limit the display to specific API consumers, API versions, HTTP methods, HTTP response codes and/or geographic locations (by country).
- A row of tiles has been added below the usage graph. This provides a snapshot of information related to the API. You can view the number of endpoints for the API, number of unique consumers, number of API versions, number of HTTP methods, number of unique HTTP response codes, and the number of unique countries from which API consumers were calling the API's endpoints. You can click on any of the boxes in that row to display more information in a popup window. You can also click Add to filter from any row displayed in the popup to filter the API usage graph described above.
- Logs for individual HTTP requests can be viewed at the bottom of the page. The logs contain the following information:
- Time (and date) - click the Time heading to reverse the order of the displayed time/date
- API consumer - Click the API consumer name to be brought to the User or Team page in the Admin Panel
- HTTP endpoint
- API version
- HTTP method
- HTTP response code
- Location - the country of origin of the API consumer
- Latency
Click the info button on the right of a log entry to display more details of the API call, such as request and response headers, and request and response bodies.
Improved:
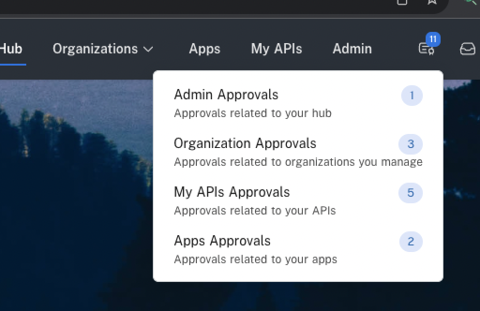
- The Approvals Center now indicates the number of open approvals relevant to you. This is a convenient way to know if you have any open approvals related to environment administration, organization administration, the APIs you own, and any apps that you manage.
- The Admin Panel's Extensions user experience has been updated to be consistent with other tabs in the Admin Panel. For more information, see Extensions.
Updated 4 months ago